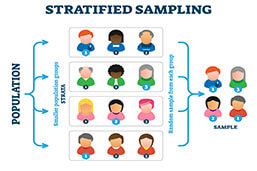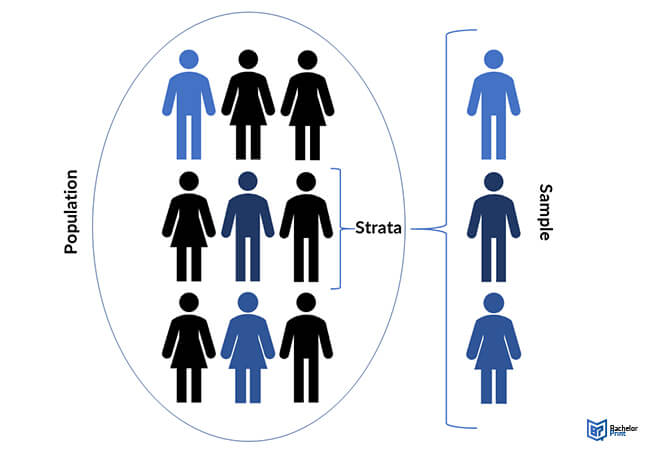
Stratified sampling is key in research methodology, statistical analysis, and research design that aims to enhance the precision of a sample. It involves dividing the population into homogeneous subgroups or ‘strata’ based on certain characteristics, and then randomly drawing samples from each stratum. This sampling method ensures that each subgroup is adequately represented in the study, reducing sampling bias and improving the accuracy of results. This article explains what the stratified sampling method entails and provides a step-by-step guide for using it.
Definition: Stratified sampling
Stratified sampling is a specialized method that segregates an entire population into distinct subgroups, or strata, which significantly differentiates it from standard sampling methods. Whereas a typical sampling process might randomly select any segment of the population for study, stratified sampling takes a more calculated approach. It ensures that various characteristics within a population are equally studied, enhancing the reliability of the findings. Moreover, each sample selected in stratified sampling doesn’t just represent the stratum it’s taken from, but indeed, it mirrors the entire population. This feature contributes to the accuracy and generalizability of the results derived from stratified sampling, making it a powerful tool in research design and statistical analysis.

Using stratified sampling correctly
It’s crucial to note that each subgroup in a stratified sampling should be mutually exhaustive and exclusive. As such, every member of a population should fit into precisely one subgroup because duplicating data in multiple strata may give unreliable results.
Stratified sampling is effective when choosing an ideal probability sampling method. This is because it may give you different mean values on the variables you’re analyzing. The stratified sampling method has potential advantages, such as:
✓ Ensures diversity. A stratified sample includes all subgroups, showing the variety of that population.
✓ Ensures a similar variance level. To have the same level of contention for all subgroups, you should collect the same sample size for all subgroups.
✓ Minimizes the overall variance. Stratified sampling becomes more homogenous with specific subgroups even when the entire population is heterogeneous.
✓ Allows a range of data collection methods. Stratified sampling entails the use of various data collection methods from different strata.
1. Stratified sampling: Defining the population
The first step of any sampling method is clearly defining the population you’ll study. Stratified sampling is no different, and it takes the following forms:
Choosing characteristics for subgrouping
Once you’ve defined your population, explain what the subgroups would look like. Choose the characteristics that will differentiate your subgroups and divide the population into the relevant groups.
When choosing the characteristics, it’s essential to note that each population member belongs to a single subgroup. Also, the classification of each item to each subset should be clear and conspicuous.
Multiple characteristics
You can also divide your population using multiple characteristics if you group every member into one subgroup. However, to get the overall number of subgroups, you should multiply the number of subgroups for each factor.
2. Stratified sampling: Separating the population
Next, assort all members and group them into a stratum. Ensure that each stratum has no overlap, is mutually exclusive, and represents the entire population when put together.
When you combine these characteristics, you get nine groups in total. You must assign each employee to one subgroup, as shown in the table below:
3. Stratified sampling: Deciding the sample size
Thirdly, decide the nature of your sample, as follows:
Proportionate vs. disproportionate sampling
The main difference between the two sampling methods is described in the table below:
| Proportionate | Disproportionate |
| Each stratum's sample size equals the proportion of the subgroup in the entire population. | The sample size is disproportionate to their representation of the entire population. |
Sample size
Next, decide your total sample size, which must adequately draw practical statistical conclusions from each subgroup. Use the sample size calculator to estimate numbers when you have errors, such as the desired margin error, standard deviation, confidence level, and estimated size.
4. Stratified sampling: Random sampling
Lastly, you can use simple random sampling for items within each stratum. Using random sampling in a stratified sampling method allows you to get samples representing that particular subgroup.
FAQs
In this method, all target population members have the opportunity to be incorporated in the sample.
When using the stratified sampling method, selecting the appropriate strata for a sample and evaluating and arranging the results is quite tricky.
Every sample should have four to six stratification variables and no more than six strata. Using more variables may increase the chance of some variables cancelling the impact of other variables.
