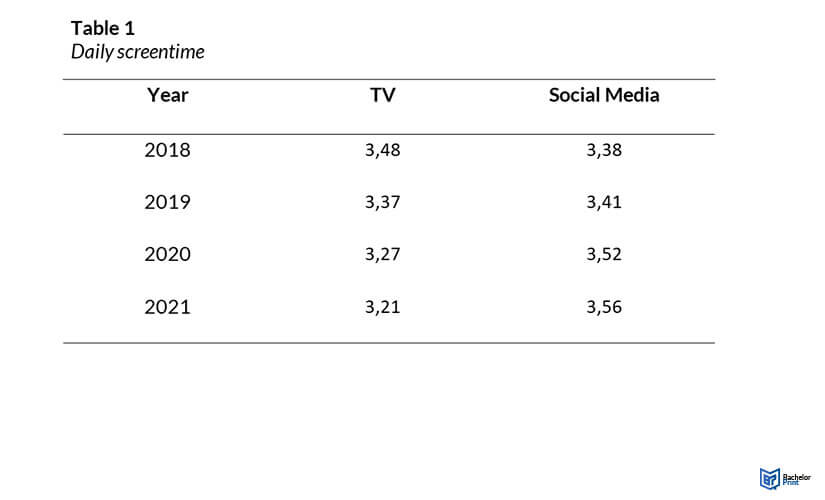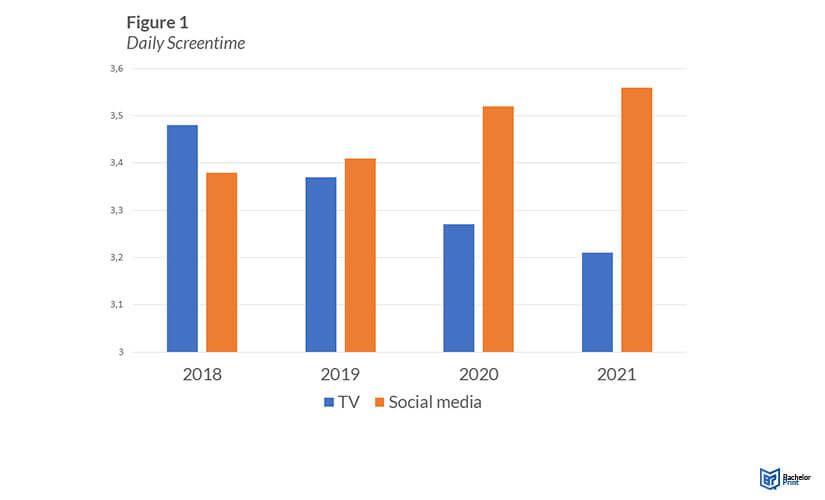
Tables and figures in APA style are instrumental in reinforcing an argument and presenting data in an accessible and impactful way. It’s crucial, however, that they serve an essential role and are not merely incorporated as space fillers. This article will guide you on effectively incorporating and formatting tables and figures according to APA style in your research, thus enabling you to produce a compelling and professionally structured research paper.
Definition: APA tables and figures

A figure is any piece of visual information that’s included in your research, including photos, pie charts, maps and more.
A table, by contrast, is an accumulation of data presented in rows and columns.
In the APA style, tables and figures are treated the same, with guidelines on how to list and present them. APA tables and figures must include reference numbers, titles and explanatory notes if needed.
Formatting APA tables and figures
Formatting is crucial for consistency and to present information clearly and concisely. The APA tables and figures guidelines specify just how your visual displays should appear throughout your paper, as such:
APA table format
While you’re free to pick a table size and style that best suits your data, APA does provide format guidelines for design and labelling. Here are the key points to making an APA-approved table:
- Include a table number above the table in bold.
- Include a short title in italics below the table.
- Notes are provided beneath the table.
- Do not use vertical lines.
- Horizontal lines should be used for clarity.
- Ensure that column and row headings are clearly labelled.
- Numbers should be used consistently throughout.

APA figure format
Any supplementary visual materials are known as figures, whether a data graphic like a flowchart or an artwork illustration. You don’t have to separate your figures into categories of type; they are all known as figures. Here are some key points when using figures in the APA style:
- Number each figure in bold above it, starting at “Figure 1”.
- Use a brief title in italics under the figure number.
- With data visualizations, ensure labels and legends are clear within the figure and not separated.
- Text within a figure should be concise with an equivalent size of between 8 to 14 points.
- Provide any necessary notes beneath the figure, labelled “Note”.

Labelling APA tables and figures
APA tables and figures follow similar labelling conventions. They should be both numbered and titled. The numbering of APA tables and figures relates to their appearance in the text. Table 1 is the first table referred to in the text, and Figure 7 would be the 7th image to be discussed. When it comes to titling, avoid articles to keep labelling concise and straightforward.
The table or figure number appears in bold with an italicized title below, as such:
Formatting APA tables and figures notes
Notes are included where further explanation is required to understand the table or figure. Notes should only concern clarity of data, not analysis – as this is for your paper’s text. There are three note types, as outlined below.
General notes
General notes are the first to appear. They include explanations that apply to the figure or table or a citation if is sourced/adapted from elsewhere. You should also include definitions and abbreviations here. For example:
Specific notes
Specific notes refer explicitly to expressions within the table or figure. Labelled alphabetically in superscript lowercase, they are used to provide need-to-know information about specific terms or data points. For example:
Probability notes
Probability notes contain relevant probability data for statistical significance. They are indicated by a p and asterisks corresponding with the table or figure. They are not preceded by a Note title. For example:
Where are APA tables and figures placed?
You have two options of where to place APA tables and figures: throughout the text or at the end of the text.
Let’s have a look at the two options in detail:
- If you place APA tables and figures throughout the text, each should appear just once, simply place it as close to the paragraph in which it is first referenced.
- Placing APA tables and figures at the end prevents them from breaking up text. Allow one page per table or figure. Begin your end section with tables in numerical order before listing figures in numerical order.
How to refer to APA tables and figures
When it comes to discussing APA tables and figures, it is to analyze or address a particular data point, not to simply repeat what is clearly shown. Furthermore, always refer to the table or figure exactly as it is listed and not by its position in the text. Not only do manuscript layouts change, but it’s always clearer to highlight evidence by name.
FAQs
A table or figure should be used when it presents information in a clearer way than describing it. This goes for presenting large sets of data or identifying evidence in a photograph.
While it isn’t a requirement under APA guidelines, lists are recommended to help guide your readers.
No. APA guidelines stress that the full expression, “Figure”, is the convention and should be used.
